<%NUMBERING1%>.<%NUMBERING2%>.<%NUMBERING3%> PRTG Manual: Group Settings
The following settings are available on the Settings tab of a group.
 This documentation does not refer to the settings of the root group. For more information, see section Root Group Settings.
 We recommend that you define as many settings as possible in the root group settings so that you can inherit them to all other objects in the object hierarchy.
 This documentation refers to an administrator that accesses the PRTG web interface on a master node. Other user accounts, interfaces, or failover nodes might not have all of the options in the way described here. In a cluster, note that failover nodes are read-only by default.
In this section:
Basic Group Settings

Basic Group Settings
|
|
|
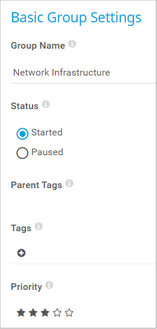
Group Name
|
Enter a name to identify the group. By default, PRTG shows this name in the device tree, as well as in alarms, logs, notifications, reports, maps, libraries, and tickets.
 If the name contains angle brackets (<>), PRTG replaces them with braces ({}) for security reasons. For more information, see the Knowledge Base: What security features does PRTG include? If the name contains angle brackets (<>), PRTG replaces them with braces ({}) for security reasons. For more information, see the Knowledge Base: What security features does PRTG include?
|
Status
|
Select the monitoring status of the group:
- Started: Monitor the group.
- Paused: Pause monitoring for the group. All sensors on all devices in the group are in the Paused status until you change this setting.
|
Parent Tags
|
Shows the tags that this group inherits from its parent probe.
 This setting is for your information only. You cannot change it. This setting is for your information only. You cannot change it.
|
Tags
|
Enter one or more tags. Confirm each tag with the Spacebar key, a comma, or the Enter key. You can use tags to group objects and use tag-filtered views later on. Tags are not case-sensitive. Tags are automatically inherited.
 It is not possible to enter tags with a leading plus (+) or minus (-) sign, nor tags with parentheses (()) or angle brackets (<>). It is not possible to enter tags with a leading plus (+) or minus (-) sign, nor tags with parentheses (()) or angle brackets (<>).
 For performance reasons, it can take some minutes until you can filter for new tags that you added. For performance reasons, it can take some minutes until you can filter for new tags that you added.
|
Priority
|
Select a priority for the group. This setting determines the position of the group in lists. The highest priority is at the top of a list. You can choose from the lowest priority ( ) to the highest priority ( ) to the highest priority ( ). ).
|
Device Identification and Auto-Discovery

Device Identification and Auto-Discovery
|
|
|
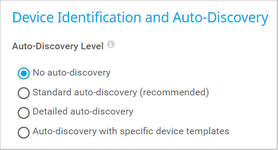
Auto-Discovery Level
|
Select the level of detail for the auto-discovery:
- No auto-discovery: Select this option if you only want to manually create devices and sensors.
- Standard auto-discovery (recommended): Create a set of standard sensors for standard monitoring. This option works fine for most installations.
- Detailed auto-discovery: Create all standard sensors and additional sensors from detailed variants of device templates. As a result, you might get many sensors. This option is suitable for small network segments and whenever you want to monitor the maximum number of sensors available.
- Auto-discovery with specific device templates: Customize the auto-discovery and select or combine standard, detailed, and custom device templates. Select one or more templates from the Device Templates list.
 Auto-discoveries can be resource intensive. They are primarily intended for devices on the same network as your probes. Auto-discoveries can be resource intensive. They are primarily intended for devices on the same network as your probes.
|
Device Templates
|
This setting is only visible if you select Auto-discovery with specific device templates above. Select one or more device templates by enabling a check box in front of the template name.
 You can also select all items or cancel the selection by using the check box in the table header. You can also select all items or cancel the selection by using the check box in the table header.
PRTG uses the device templates that you select for the auto-discovery on the device. Choose from:
- ADSL
- Amazon CloudWatch
- Buffalo TeraStation NAS
- Cisco ASA VPN
- Cisco Device (Generic)
- Dell EqualLogic
- Dell MDi Disk
- DNS Server
- Environment Jacarta
- Environment Poseidon
- FTP Server
- Generic Device (Ping Only)
- Generic Device (SNMP Enabled)
- Generic Device (SNMP Enabled, Detailed)
- HTTP Web Server
- Hyper-V Host Server
- IPMI-enabled Device
- Juniper NS Device
- Linux/UNIX Device (SNMP or SSH Enabled)
- Mail Server (Generic)
- Mail Server (MS Exchange)
- Microsoft SharePoint 2010
- NAS LenovoEMC
- NAS QNAP
- NAS Synology
- NetApp
- NTP Server
- Printer (HP)
- Printer (Generic)
- RDP Server
- RMON-compatible Device
- Server (Cisco UCS)
- Server (Compaq/HP Agents)
- Server (Dell)
- Server (Fujitsu)
- Server (IBM)
- SonicWall
- SSL Security Check
- Switch (Cisco Catalyst)
- Switch (Cisco IOS Based)
- Switch (HP Procurve)
- UNIX/Linux Device
- UPS Health (APC)
- UPS Health (Generic)
- UPS Health (Liebert)
- VMware ESXi / vCenter Server
- Web Server
- Windows (Detailed via WMI)
- Windows (via Remote PowerShell)
- Windows (via WMI)
- Windows IIS (via SNMP)
- XenServer Hosts
- XenServer Virtual Machines
Once the auto-discovery is finished, PRTG creates a new ticket and lists the device templates that it used to create new sensors.
|
Schedule
|
Select when PRTG runs the auto-discovery:
- Once: Run the auto-discovery only once. PRTG adds new devices and sensors once. If you select this option, you must manually start the auto-discovery.
- Hourly: Run the auto-discovery for new devices and sensors every 60 minutes.
 Use this option with caution. Frequent auto-discoveries might cause performance issues, in particular when PRTG scans large network segments every hour. Use this option with caution. Frequent auto-discoveries might cause performance issues, in particular when PRTG scans large network segments every hour.
- Daily: Run the auto-discovery for new devices and sensors every 24 hours. The first auto-discovery runs immediately. All other discoveries start at the time that you define in the Monitoring settings, section Auto-Discovery.
- Weekly: Run the auto-discovery for new devices and sensors every 7 days. The first auto-discovery runs immediately. All other discoveries start at the time that you define in the Monitoring settings, section Auto-Discovery.
 For performance reasons, PRTG sets Schedule to Once on all devices that the scheduled auto-discovery creates. For performance reasons, PRTG sets Schedule to Once on all devices that the scheduled auto-discovery creates.
|
IP Address Selection Method
|
Select how you want to define the IP address range for the auto-discovery:
- Class C base IP address with start/end (IPv4): Enter an IPv4 class C address range.
- List of individual IP addresses and DNS names (IPv4): Enter a list of individual IPv4 addresses or Domain Name System (DNS) names.
- IP address and subnet (IPv4): Enter an IPv4 address and subnet mask.
- IP address with octet range (IPv4): Enter an IPv4 address range for every IP octet individually. With this, you can define very customizable IP address ranges.
- List of individual IP addresses and DNS names (IPv6): Enter a list of individual IPv6 addresses or DNS names.
- Use computers from the Active Directory (maximum 1000 computers): Search in the Active Directory for computers to perform the auto-discovery.
 Make sure that you specify your Active Directory domain in the Core & Probes settings. Make sure that you specify your Active Directory domain in the Core & Probes settings.
 PRTG can only discover subnets with up to 65,536 IP addresses. If you define a range with a higher number of addresses, the discovery stops before it is completed. PRTG can only discover subnets with up to 65,536 IP addresses. If you define a range with a higher number of addresses, the discovery stops before it is completed.
|
IPv4 Base
|
This setting is only visible if you select Class C base IP address with start/end (IPv4) above. Enter a class C network as the IP base for the auto-discovery. Enter the first three octets of an IPv4 address, for example, 192.168.0.
|
IPv4 Range Start
|
This setting is only visible if you select Class C base IP address with start/end (IPv4) above. Enter the IP octet of the class C network (specified above) from which PRTG starts the auto-discovery. This completes the IP base to an IPv4 address. For example, enter 1 to discover from 192.168.0.1 onwards.
|
IPv4 Range End
|
This setting is only visible if you select Class C base IP address with start/end (IPv4) above. Enter the IP octet of the class C network (specified above) at which PRTG stops the auto-discovery. This completes the IP base to an IPv4 address. For example, enter 254 to discover up to 192.168.0.254.
|
IPv4/DNS Name List
IPv6/DNS Name List
|
This setting is only visible if you select List of individual IP addresses and DNS names (IPv4) or List of individual IP addresses and DNS names (IPv6) above. Enter a list of IP addresses or DNS names that the auto-discovery scans. Enter each address on a separate line.
|
IPv4 and Subnet (IPv4)
|
This setting is only visible if you select IP address and subnet (IPv4) above. Enter an expression in the format address/subnet, for example, 192.168.3.0/255.255.255.0. You can also use the short form like 192.168.3.0/24. PRTG scans the complete host range (without network and broadcast address) that is defined by the IP address and the subnet mask.
|
IP Address with Octet Range
|
This setting is only visible if you select IP address with octet range (IPv4) above. Enter an expression in the format a1.a2.a3.a4, where a1, a2, a3, and a4 are each a number between 0-255, or a range with two numbers and a hyphen like 1-127. PRTG calculates all permutations of all ranges. For example, 10.0.1-10.1-100 results in 1,000 IP addresses that PRTG scans during the auto-discovery.
|
Organizational Unit
|
This setting is only visible if you select Use computers from the Active Directory (maximum 1000 computers) above. Enter an organizational unit (OU) to restrict the Active Directory search to computers that are part of this OU. For top-level OUs, use the distinguished name (DN) format without OU= and without the domain components (DCS). If you leave this field empty, there are not any restrictions.
Example:
- For the DN OU=Domain Controllers,DC=example,DC=com, enter only Domain Controllers.
If you have sub-OUs, use the DN format without the leading OU= and without the DCs.
Examples:
- For the DN OU=webserver,OU=production,DC=example,DC=com, enter only webserver,OU=production.
- For the DN OU=intranet,OU=webserver,OU=production,DC=example,DC=com, enter only intranet,OU=webserver,OU=production.
 Make sure that the OU contains computer accounts. If the OU is empty, you receive an error message. Make sure that the OU contains computer accounts. If the OU is empty, you receive an error message.
 Do not enter the domain components. PRTG automatically uses the domain components from the domain name you enter in the Core & Probes settings. Do not enter the domain components. PRTG automatically uses the domain components from the domain name you enter in the Core & Probes settings.
|
Name Resolution
|
Select how to monitor newly discovered devices. This only affects new devices. This does not change the setting for other devices. Depending on your selection, the IP Address/DNS Name field of an added device shows the DNS name or IP address that PRTG uses to access the target device. Choose between:
- Use DNS names (recommended): Monitor newly discovered devices via their DNS names (if available). We recommend that you use this option.
- Use IP addresses: Monitor newly discovered devices via their IP addresses.
 This setting does not affect how PRTG shows the devices in the device tree. This setting does not affect how PRTG shows the devices in the device tree.
|
Device Rescan
|
Select how to handle known devices:
- Skip auto-discovery for existing devices/IP addresses (recommended): Do not rescan existing devices or IP addresses. PRTG only adds devices with new IP addresses or DNS names. PRTG does not add devices that that already exist in your configuration for example, in other groups. We recommend that you use this option.
- Perform auto-discovery for existing devices/IP addresses: Rescan devices that have existing IP addresses with every auto-discovery. PRTG adds devices that already exist in other groups to this group and runs the auto-discovery on the newly added devices.
 The auto-discovery does not run on devices that already exist in the group. If you want to run the auto-discovery for these devices, you must manually start the auto-discovery on them. The auto-discovery does not run on devices that already exist in the group. If you want to run the auto-discovery for these devices, you must manually start the auto-discovery on them.
 In certain cases, the IP resolution might not work and might result in PRTG not adding a device if it has the same local IP address as it does in a different LAN. In certain cases, the IP resolution might not work and might result in PRTG not adding a device if it has the same local IP address as it does in a different LAN.
|
Inherited Settings
By default, all of these settings are inherited from objects that are higher in the hierarchy. We recommend that you change them centrally in the root group settings if necessary. To change a setting for this object only, click  under the corresponding setting name to disable the inheritance and to display its options.
 For more information, see section Inheritance of Settings.
Location
Click  to interrupt the inheritance.

Location
|
|
|
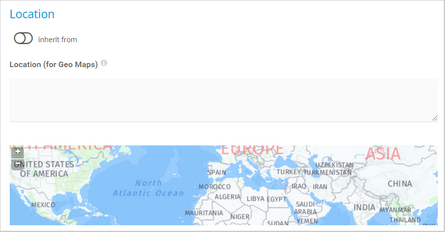
Location (for Geo Maps)
|
If you want to use Geo Maps, enter a location in the first line. Geographical maps then display objects like devices or groups with a status icon using a color code similar to the sensor status icons (green–yellow–orange–red). You can enter a full postal address, city and country only, or latitude and longitude. It is possible to enter any text before, between, and after the coordinates, as PRTG automatically parses latitude and longitude, for example, enter 49.452778 11.077778, or enter 49.452778 any 11.077778 text.
A minus sign (-) in the first line hides an object from a geographical map. In this case, you can enter location information in line two and following.
You can define a specific label for each location. Enter a string denoting the label in the first line and provide the coordinates in the second line. This geographical marker then shows the object with the label in the geographical map.
 The preview map always has a road map layout regardless of the map layout you set in User Interface. The preview map always has a road map layout regardless of the map layout you set in User Interface.
|
Credentials for Windows Systems
Click  to interrupt the inheritance.

Credentials for Windows Systems
|
|
|
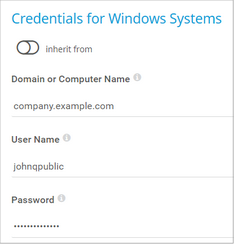
Domain or Computer Name
|
Enter the domain or computer name of the user account with which you want to access the Windows system. PRTG uses this account for Windows Management Instrumentation (WMI) sensors and other Windows sensors.
If you want to use a Windows local user account on the target device, enter the computer name. If you want to use a Windows domain user account (recommended), enter the domain name. PRTG automatically adds a prefix to use the NT LAN Manager (NTLM) protocol if you do not explicitly define it. Do not leave this field empty.
|
User Name
|
Enter the user name for access to the Windows system. Usually, you use credentials with administrator rights.
|
Password
|
Enter the password for access to the Windows system. Usually, you use credentials with administrator rights.
|
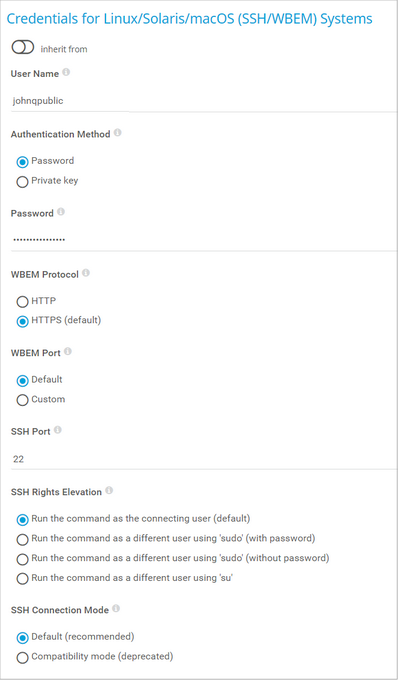
Credentials for Linux/Solaris/macOS (SSH/WBEM) Systems
Click  to interrupt the inheritance.

Credentials for Linux/Solaris/macOS (SSH/WBEM) Systems
|
|
|
User Name
|
Enter the user name for access to the Linux/Solaris/macOS system via Secure Shell (SSH) and Web-based Enterprise Management (WBEM). Usually, you use credentials with administrator rights.
|
Authentication Method
|
Select the authentication method for login:
- Password: Provide the password for the login.
- Private key: Provide an RSA private key for authentication.
 PRTG can only handle keys in the OpenSSH format that are not encrypted. You cannot use password-protected keys. PRTG can only handle keys in the OpenSSH format that are not encrypted. You cannot use password-protected keys.
 PRTG only supports RSA keys. It does not support DSA keys. PRTG only supports RSA keys. It does not support DSA keys.
 For details, see section Monitoring via SSH. For details, see section Monitoring via SSH.
|
Password
|
This setting is only visible if you select Password above. Enter a password for access to the Linux/Solaris/macOS system via SSH and WBEM. Usually, you use credentials with administrator rights.
|
Private Key
|
This setting is only visible if you select Private key above. Paste the entire RSA private key, including the BEGIN and END lines. Make sure that a corresponding public key exists on the target device.
 PRTG can only handle keys in the OpenSSH format that are not encrypted. You cannot use password-protected keys. PRTG can only handle keys in the OpenSSH format that are not encrypted. You cannot use password-protected keys.
 PRTG only supports RSA keys. It does not support DSA keys. PRTG only supports RSA keys. It does not support DSA keys.
 For details, see section Monitoring via SSH. For details, see section Monitoring via SSH.
 If you do not insert a private key for the first time but if you want to change the private key, you need to restart the PRTG core server service for the private key change to take effect. If you do not insert a private key for the first time but if you want to change the private key, you need to restart the PRTG core server service for the private key change to take effect.
|
WBEM Protocol
|
Select the protocol that you want to use for the connection to the system via WBEM:
- HTTP: Use an unsecure connection for WBEM.
- HTTPS (default): Use a Secure Sockets Layer (SSL)/Transport Layer Security (TLS) secured connection for WBEM.
 This setting is only relevant if you use WBEM sensors. This setting is only relevant if you use WBEM sensors.
|
WBEM Port
|
Select if you want to use one of the default ports for the connection to the system via WBEM or if you want to set a custom port:
- Default: Use one of the default ports. The default port for unsecure connections is 5988 and the default port for secure connections is 5989.
- Custom: Use a custom port.
 This setting is only relevant if you use WBEM sensors. This setting is only relevant if you use WBEM sensors.
|
Custom WBEM Port
|
This setting is only visible if you select Custom above. Enter a custom WBEM port. Enter an integer.
|
SSH Port
|
Enter the port for SSH connections. Enter an integer. The default port is 22.
 By default, PRTG automatically uses this setting for all SSH sensors unless you define a different port number in the sensor settings. By default, PRTG automatically uses this setting for all SSH sensors unless you define a different port number in the sensor settings.
|
SSH Rights Elevation
|
Select the rights that you want to use to run the command on the target system:
- Run the command as the connecting user (default): Use the rights of the user who establishes the SSH connection.
- Run the command as a different user using 'sudo' (with password): Use the rights of a different user with a password required for sudo to run commands on the target system, for example, as a root user.
- Run the command as a different user using 'sudo' (without password): Use the rights of a different user without a password required for sudo to run commands on the target system, for example, as a root user.
- Run the command as a different user using 'su': Use the rights of a different user with su to run commands on the target system.
|
Target System User Name
|
This setting is only visible if you select an option that includes sudo or su above. Enter a user name to run the specified command on the target system as a different user than the root user. If you leave this field empty, you run the command as a root user. Make sure that you set the Linux password even if you use a public key or a private key for authentication. This is not necessary if the user is allowed to run the command without a password.
|
Password
|
This setting is only visible if you select an option that includes sudo or su with password above. Enter the password to run the sudo command or the su command.
|
SSH Connection Mode
|
Select the connection mode that you want to use to access data with SSH sensors:
- Default (recommended): This is the default monitoring method for SSH sensors. It provides the best performance and security.
- Compatibility mode (deprecated): Use this mode only if the default mode does not work on the target system. The compatibility mode is the SSH engine that PRTG used in previous versions and it is deprecated.
 We strongly recommend that you use the default SSH connection mode. We strongly recommend that you use the default SSH connection mode.
 You can also individually select the SSH connection mode for each SSH sensor in the sensor settings. You can also individually select the SSH connection mode for each SSH sensor in the sensor settings.
|
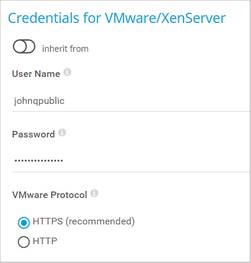
Credentials for VMware/XenServer
Click  to interrupt the inheritance.

Credentials for VMware/XenServer
|
|
|
User Name
|
Enter the user name for access to VMware ESXi, vCenter Server, or Citrix XenServer. Usually, you use credentials with administrator rights.
|
Password
|
Enter the password for access to VMware ESXi, vCenter Server, or Citrix XenServer. Usually, you use credentials with administrator rights.
 Single sign-on (SSO) passwords for vSphere do not support special characters. For details, see the VMware sensors sections. Single sign-on (SSO) passwords for vSphere do not support special characters. For details, see the VMware sensors sections.
|
VMware Protocol
|
Select the protocol for the connection to VMware ESXi, vCenter Server, or Citrix XenServer:
- HTTPS (recommended): Use a Secure Sockets Layer (SSL)/Transport Layer Security (TLS) secured connection.
- HTTP: Use an unsecure connection.
|
Session Handling
|
Select if you want to reuse a session for VMware sensors:
- Reuse a session for multiple scans (recommended): Select this option if you want a VMware sensor to reuse a single session for multiple sensor scans to query data. With this option, the sensor does not need to log in and out for each sensor scan. We recommend that you use this option because it reduces network load and log entries on the target device. This can increase performance.
- Create a new session for each scan: If you select this option, PRTG does not reuse a session and a VMware sensor has to log in and out for each sensor scan. This can decrease performance.
|
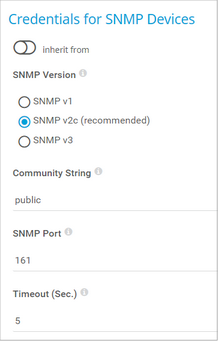
Credentials for SNMP Devices
Click  to interrupt the inheritance.

Credentials for SNMP Devices
|
|
|
SNMP Version
|
Select the Simple Network Management Protocol (SNMP) version for the connection to the target SNMP device:
- SNMP v1: Use SNMP v1 for the connection. SNMP v1 only offers clear-text data transmission.
 SNMP v1 does not support 64-bit counters. This might result in invalid data when you monitor traffic via SNMP. SNMP v1 does not support 64-bit counters. This might result in invalid data when you monitor traffic via SNMP.
- SNMP v2c (recommended): Use SNMP v2c for the connection. SNMP v2c also only offers clear-text data transmission but it supports 64-bit counters.
- SNMP v3: Use SNMP v3 for the connection. SNMP v3 provides secure authentication and data encryption.
 SNMP v3 has performance limitations because of the use of encryption. The main limiting factor is CPU power. Also keep in mind that SNMP v3, unlike SNMP v1 and v2c, does not scale with more CPU power. Because of this limitation, PRTG can only handle a limited number of requests per second so that you can use only a limited number of sensors using SNMP v3. If you see an increase in Interval Delay or Open Requests with the Probe Health sensor, distribute the load over multiple probes. SNMP v1 and SNMP v2c do not have this limitation. SNMP v3 has performance limitations because of the use of encryption. The main limiting factor is CPU power. Also keep in mind that SNMP v3, unlike SNMP v1 and v2c, does not scale with more CPU power. Because of this limitation, PRTG can only handle a limited number of requests per second so that you can use only a limited number of sensors using SNMP v3. If you see an increase in Interval Delay or Open Requests with the Probe Health sensor, distribute the load over multiple probes. SNMP v1 and SNMP v2c do not have this limitation.
|
Community String
|
This setting is only visible if you select SNMP v1 or SNMP v2c (recommended) above. Enter the community string of your device. This is like a clear-text password for simple authentication.
 We recommend that you use the default value. We recommend that you use the default value.
|
Authentication Method
|
This setting is only visible if you select SNMP v3 above. Select the authentication method:
- MD5: Use message-digest algorithm 5 (MD5) for authentication.
- SHA: Use Secure Hash Algorithm (SHA) for authentication.
 If you do not want to use authentication but you need SNMP v3, for example, because your device requires context, you can leave the Password field empty. In this case, PRTG uses SNMP_SEC_LEVEL_NOAUTH and it entirely deactivates authentication. If you do not want to use authentication but you need SNMP v3, for example, because your device requires context, you can leave the Password field empty. In this case, PRTG uses SNMP_SEC_LEVEL_NOAUTH and it entirely deactivates authentication.
 The authentication method you select must match the authentication method of your device. The authentication method you select must match the authentication method of your device.
|
User Name
|
This setting is only visible if you select SNMP v3 above. Enter the user name for access to the target SNMP device.
 The user name that you enter must match the user name of your device. The user name that you enter must match the user name of your device.
|
Password
|
This setting is only visible if you select SNMP v3 above. Enter the password for access to the target SNMP device.
 The password that you enter must match the password of your device. The password that you enter must match the password of your device.
|
Encryption Type
|
This setting is only visible if you select SNMP v3 above. Select an encryption type:
- DES: Use Data Encryption Standard (DES) as the encryption algorithm.
- AES: Use Advanced Encryption Standard (AES) as the encryption algorithm.
 Net-SNMP does not support AES-192 and AES-256. They do not have RFC specifications. Net-SNMP does not support AES-192 and AES-256. They do not have RFC specifications.
 The encryption type that you select must match the encryption type of your device. The encryption type that you select must match the encryption type of your device.
|
Encryption Key
|
This setting is only visible if you select SNMP v3 above. Enter an encryption key. If you provide a key, PRTG encrypts SNMP data packets with the encryption algorithm that you selected above. Enter a string or leave the field empty.
 The encryption key that you enter must match the encryption key of your device. If the encryption keys do not match, you do not get an error message. The encryption key that you enter must match the encryption key of your device. If the encryption keys do not match, you do not get an error message.
|
Context Name
|
This setting is only visible if you select SNMP v3 above. Enter a context name only if the configuration of the device requires it. Context is a collection of management information that is accessible by an SNMP device. Enter a string.
|
SNMP Port
|
Enter the port for the connection to the SNMP target device. Enter an integer. The default port is 161.
 We recommend that you use the default value. We recommend that you use the default value.
|
Timeout (Sec.)
|
Enter a timeout in seconds for the request. Enter an integer. The maximum timeout value is 300 seconds (5 minutes).
|
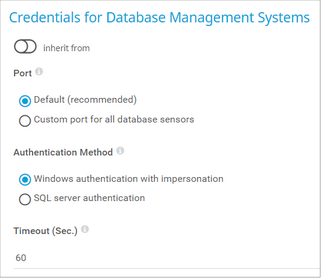
Credentials for Database Management Systems
Click  to interrupt the inheritance.
The settings you define in this section apply to the following sensors:

Credentials for Database Management Systems
|
|
|
Port
|
Enter a custom port for database connections. Enter an integer.
 PRTG uses this custom port for all database sensors and for connections to all your databases. PRTG uses this custom port for all database sensors and for connections to all your databases.
|
Custom Port
|
Enter a custom port for database connections. Enter an integer.
 PRTG uses this custom port for all database sensors and for connections to all your databases. PRTG uses this custom port for all database sensors and for connections to all your databases.
|
Authentication Method
|
This setting is only visible if you select SQL server authentication above. Enter the user name for the database connection.
|
User Name
|
This setting is only visible if you select SQL server authentication above. Enter the password for the database connection.
|
Password
|
Enter a timeout in seconds for the request. Enter an integer. The maximum timeout value is 300 seconds (5 minutes).
|
Timeout (Sec.)
|
Enter a timeout in seconds for the request. Enter an integer. The maximum timeout value is 300 seconds (5 minutes).
|
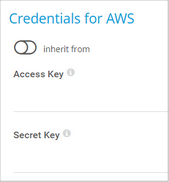
Credentials for AWS
Click  to interrupt the inheritance.
 For more information about the permissions that are necessary to query the AWS API, see the Knowledge Base: How do I set permissions for the Amazon Web Services (AWS) API key to use certain sensors in PRTG?

Credentials for AWS
|
|
|
Access Key
|
Enter the Amazon Web Services (AWS) access key.
|
Secret Key
|
Enter the AWS secret key.
|
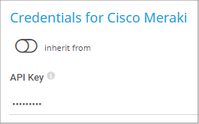
Credentials for Cisco Meraki
Click  to interrupt the inheritance.

Credentials for Cisco Meraki
|
|
|
API Key
|
Enter an API key that the sensor uses for authentication against the Cisco Meraki Dashboard API.
|
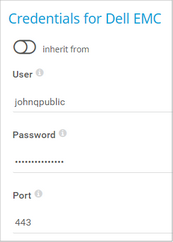
Credentials for Dell EMC
Click  to interrupt the inheritance.

Credentials for Dell EMC
|
|
|
User Name
|
Enter the user name for access to the Dell EMC system.
|
Password
|
Enter the password for access to the Dell EMC system.
|
Port
|
Enter the port for the connection to the Dell EMC system. The default port for secure connections is 443.
|
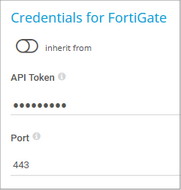
Credentials for FortiGate
Click  to interrupt the inheritance.

Credentials for FortiGate
|
|
|
API Token
|
Enter the API token for access to the FortiGate system.
|
Port
|
Enter the port for the connection to the FortiGate system. The default port for secure connections is 443.
|
Credentials for HPE 3PAR
Click  to interrupt the inheritance.

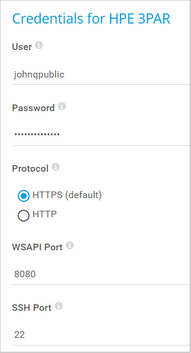
Credentials for HPE 3PAR
|
|
|
User Name
|
Enter the user name for access to the HPE 3PAR system.
|
Password
|
Enter the password for access to the HPE 3PAR system.
|
Protocol
|
Select the protocol that you want to use for the connection to the HPE 3PAR system:
- HTTPS (default): Use a Secure Sockets Layer (SSL)/Transport Layer Security (TLS) secured connection.
- HTTP: Use an unsecure connection.
|
WSAPI Port
|
Enter the Web Services API (WSAPI) port for the connection to the HPE 3PAR system. The default port for secure connections is 8080 and the default port for unsecure connections is 8008.
 For more information, see the Knowledge Base: Where can I find the Web Services API (WSAPI) port for the connection to the HPE 3PAR system? For more information, see the Knowledge Base: Where can I find the Web Services API (WSAPI) port for the connection to the HPE 3PAR system?
|
SSH Port
|
Enter the SSH port for the connection to the HPE 3PAR system. The default port for secure connections is 22.
|
Credentials for Microsoft 365
Click  to interrupt the inheritance.
 The Microsoft 365 Mailbox sensor, the Microsoft 365 Service Status sensor, and the Microsoft 365 Service Status Advanced sensor use the following credentials to authenticate with Azure Active Directory (Azure AD).
 For more information about the credentials and the permissions that are necessary to use the Microsoft 365 Service Status sensor and the Microsoft 365 Service Status Advanced sensor, see the Knowledge Base: How do I obtain credentials and set permissions for the Microsoft 365 Service Status sensors?
 For more information about the credentials and the permissions that are necessary to use the Microsoft 365 Mailbox sensor, see the Knowledge Base: How do I obtain credentials and set permissions for the Microsoft 365 Mailbox sensor?

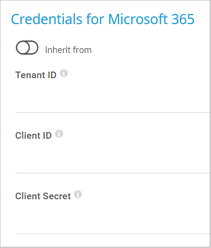
Credentials for Microsoft 365
|
|
|
Tenant ID
|
Enter the Azure AD tenant ID.
 A tenant ID must be a 32-digit sequence in hexadecimal notation. A tenant ID must be a 32-digit sequence in hexadecimal notation.
|
Client ID
|
Enter the Azure AD client ID.
|
Client Secret
|
Enter the Azure AD client secret.
|
Credentials for Microsoft Azure
Click  to interrupt the inheritance.
 The Microsoft Azure SQL Database sensor, Microsoft Azure Storage Account sensor, Microsoft Azure Subscription Cost sensor, and the Microsoft Azure Virtual Machine sensor use the following credentials to authenticate with Azure AD.
 For more information about the credentials and permissions that are necessary use the Microsoft Azure sensors, see the Knowledge Base: How do I obtain credentials and create custom roles for the Microsoft Azure sensors?

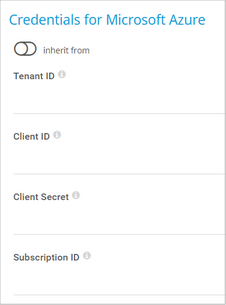
Credentials for Microsoft Azure
|
|
|
Tenant ID
|
Enter the Azure AD tenant ID.
 A tenant ID must be a 32-digit sequence in hexadecimal notation. A tenant ID must be a 32-digit sequence in hexadecimal notation.
|
Client ID
|
Enter the Azure AD client ID.
|
Client Secret
|
Enter the Azure AD client secret.
|
Subscription ID
|
Enter the Azure AD subscription ID.
|
Credentials for MQTT
Click  to interrupt the inheritance.

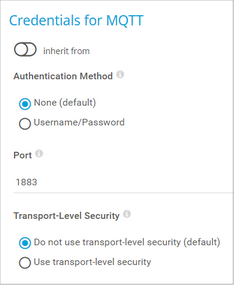
Credentials for MQTT
|
|
|
Authentication Method
|
Select if you want to connect without credentials or define credentials for access to the MQTT broker.
- None (default): Connect without credentials.
- User name and password: Define credentials for the connection.
|
User Name
|
This setting is only visible if you select User name and password above. Enter the user name for access to the Message Queue Telemetry Transport (MQTT) broker.
|
Password
|
This setting is only visible if you select User name and password above. Enter the password for access to the MQTT broker.
|
Port
|
Enter the port for the connection to the MQTT broker. The default port for secure connections is 8883 and the default port for unsecure connections is 1883.
|
Transport-Level Security
|
Select if you want to use a Secure Sockets Layer (SSL)/Transport Layer Security (TLS) secured connection:
- Do not use transport-level security: Establish the connection without connection security.
- Use transport-level security: Establish the connection with the strongest SSL/TLS method that the target device provides.
|
Server Authentication
|
This setting is only visible if you select Use transport-level security above. Select if you want to use a certificate for server authentication.
- Disable (default): Do not use a certificate for server authentication.
- Enable: Use a certificate for server authentication.
|
CA Certificate
|
This setting is only visible if you enable Server Authentication above. Paste the certificate authority (CA) certificate for the verification of the MQTT broker.
 The certificate must be in Privacy-Enhanced Mail (PEM) format. The certificate must be in Privacy-Enhanced Mail (PEM) format.
|
Client Authentication
|
This setting is only visible if you select Use transport-level security above. Select if you want to use a certificate for client authentication.
- Disable (default): Do not use a certificate for client authentication.
- Enable: Use a certificate for client authentication.
|
Client Certificate
|
This setting is only visible if you enable Client Authentication above. Paste the certificate that you created for authenticating the sensor against the MQTT broker.
 The certificate must be in PEM format. The certificate must be in PEM format.
|
Client Key
|
This setting is only visible if you enable Client Authentication above. Enter the client key for access to the MQTT broker.
 The client key must be in PEM format and it must be encrypted using the Client Key Password. The client key must be in PEM format and it must be encrypted using the Client Key Password.
|
Client Key Password
|
This setting is only visible if you enable Client Authentication above. Enter the password for the client key.
|
Credentials for NetApp
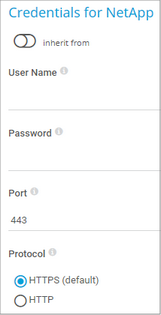
 The NetApp System Health v2 sensor and the NetApp Volume v2 sensor use the following credentials for access to the ONTAP System Manager.
Click  to interrupt the inheritance.

Credentials for NetApp
|
|
|
User Name
|
Enter a user name for access to the ONTAP System Manager.
|
Password
|
Enter the password for access to the ONTAP System Manager.
|
Port
|
Enter the port for the connection to the ONTAP System Manager. The default port for secure connections is 443.
|
Protocol
|
Select the protocol that you want to use for the connection to the ONTAP System Manager. Choose between:
|
Credentials for OPC UA
Click  to interrupt the inheritance.

Credentials for OPC UA
|
|
|
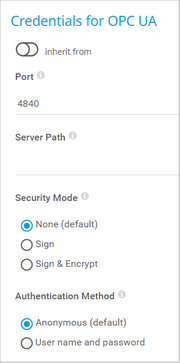
Port
|
Enter the port for the connection to the OPC Unified Architecture (OPC UA) server. The default port for secure connections is 4840.
|
Server Path
|
Enter the path of the OPC UA server endpoint if you run more than one server under the same IP address or DNS name.
|
Security Mode
|
Select if you want to use encryption:
- None (default): Do not use encryption.
- Sign: Sign messages between the sensor and the OPC UA server.
- Sign & Encrypt: Sign and encrypt messages between the sensor and the OPC UA server.
|
Security Policy
|
This setting is only visible if you select Sign or Sign & Encrypt above. Select if you want to use a security policy and define which policy you want to use:
- None (default): Do not use a security policy.
- Basic256Sha256: Use the Basic256Sha256 security policy.
- Basic256: Use the Basic256 security policy.
|
Client Certificate
|
Paste the certificate that you created for authenticating the sensor against the OPC UA server.
 The certificate must meet the following requirements: The certificate must meet the following requirements:
- The key size must be 2048-bit.
- The secure hash algorithm must be SHA256.
- DataEncipherment must be part of the KeyUsage certificate extension.
- A uniform resource indicator (URI) must be set in subjectAltName.
- The certificate must be in Privacy-Enhanced Mail (PEM) format.
|
Client Key
|
Enter the client key for access to the OPC UA server.
 The client key must be in PEM format and it must be encrypted using the Client Key Password. The client key must be in PEM format and it must be encrypted using the Client Key Password.
|
Client Key Password
|
Enter the password for the client key.
|
Authentication Method
|
Select if you want to connect without credentials or define credentials for access to the OPC UA server:
- Anonymous (default): Connect without credentials.
- User name and password: Define credentials for the connection.
 Most OPC UA servers do not support User name and password authentication without a client certificate. To use User name and password authentication, select Sign or Sign & Encrypt under Security Mode and Basic256Sha256 or Basic256 under Security Policy and enter the Client Certificate, Client Key, and Client Key Password that you want to use. Most OPC UA servers do not support User name and password authentication without a client certificate. To use User name and password authentication, select Sign or Sign & Encrypt under Security Mode and Basic256Sha256 or Basic256 under Security Policy and enter the Client Certificate, Client Key, and Client Key Password that you want to use.
|
User Name
|
This setting is only visible if you select User name and password above. Enter the user name for access to the OPC UA server.
|
Password
|
This setting is only visible if you select User name and password above. Enter the password for access to the OPC UA server.
|
Credentials for Soffico Orchestra
Click  to interrupt the inheritance.

Credentials for Soffico Orchestra
|
|
|
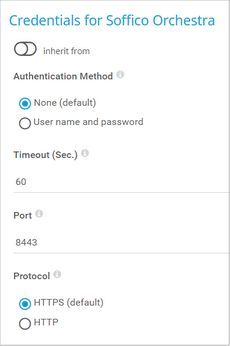
Authentication Method
|
Select if you want to connect without credentials or define credentials for access to the Orchestra platform:
- None (default): Connect without credentials.
- User name and password: Define credentials for the connection.
|
User Name
|
This setting is only visible if you select User name and password above. Enter the user name for access to the Orchestra platform.
|
Password
|
This setting is only visible if you select User name and password above. Enter the password for access to the Orchestra platform.
|
Timeout (Sec.)
|
Enter a timeout in seconds for the request. Enter an integer. The maximum timeout value is 300 seconds (5 minutes).
|
Port
|
Enter the port for the connection to the Orchestra platform. The default port for secure connections is 8443 and the default port for unsecure connections is 8019.
|
Protocol
|
Select the protocol that you want to use for the connection to the Orchestra platform:
- HTTPS (default): Use a Secure Sockets Layer (SSL)/Transport Layer Security (TLS) secured connection.
- HTTP: Use an unsecure connection.
|
Credentials for Redfish
Click  to interrupt the inheritance.

Credentials for Redfish
|
|
|
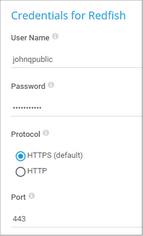
User Name
|
Enter the user name for access to the Redfish system.
|
Password
|
Enter the password for access to the Redfish system.
|
Protocol
|
Select the protocol that you want to use for the connection to the Redfish system. Choose between:
- HTTPS (default): Use a Secure Sockets Layer (SSL)/Transport Layer Security (TLS) secured connection.
- HTTP: Use an unsecure connection.
|
Port
|
Enter the port for the connection to the Redfish system. The default port for secure connections is 443.
|
Credentials for REST API
Click  to interrupt the inheritance.

Credentials for REST API
|
|
|
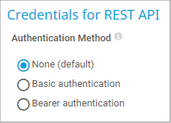
Authentication Method
|
Select the authentication method for access to the Representational State Transfer (REST) application programming interface (API):
- None (default): Use no authentication.
- Basic authentication: Use basic authentication.
- Bearer authentication: Use an OAuth2 bearer token.
|
User Name
|
This setting is only visible if you select Basic authentication above. Enter the user name for access to the REST API.
|
Password
|
This setting is only visible if you select Basic authentication above. Enter the password for access to the REST API.
|
Bearer Token
|
This setting is only visible if you select Bearer authentication above. Enter a bearer token for access to the REST API.
|
Placeholder 1 Description
|
Enter a description for Placeholder 1, for example information about the purpose or content of the placeholder.
|
Placeholder 1
|
Enter a value for the placeholder. PRTG inserts the value for the REST API request if you add %restplaceholder1 in the Request URL, POST Body, and Custom Headers fields of the REST Custom v2 sensor. PRTG does not display the value in the sensor log or the sensor's settings.
|
Placeholder 2 Description
|
Enter a description for Placeholder 2, for example information about the purpose or content of the placeholder.
|
Placeholder 2
|
Enter a value for the placeholder. PRTG inserts the value for the REST API request if you add %restplaceholder2 in the Request URL, POST Body, and Custom Headers fields of the REST Custom v2 sensor. PRTG does not display the value in the sensor log or the sensor's settings.
|
Placeholder 3 Description
|
Enter a description for Placeholder 3, for example information about the purpose or content of the placeholder.
|
Placeholder 3
|
Enter a value for the placeholder. PRTG inserts the value for the REST API request if you add %restplaceholder3 in the Request URL, POST Body, and Custom Headers fields of the REST Custom v2 sensor. PRTG does not display the value in the sensor log or the sensor's settings.
|
Placeholder 4 Description
|
Enter a description for Placeholder 4, for example information about the purpose or content of the placeholder.
|
Placeholder 4
|
Enter a value for the placeholder. PRTG inserts the value for the REST API request if you add %restplaceholder4 in the Request URL, POST Body, and Custom Headers fields of the REST Custom v2 sensor. PRTG does not display the value in the sensor log or the sensor's settings.
|
Placeholder 5 Description
|
Enter a description for Placeholder 5, for example information about the purpose or content of the placeholder.
|
Placeholder 5
|
Enter a value for the placeholder. PRTG inserts the value for the REST API request if you add %restplaceholder5 in the Request URL, POST Body, and Custom Headers fields of the REST Custom v2 sensor. PRTG does not display the value in the sensor log or the sensor's settings.
|
Credentials for Veeam
Click  to interrupt the inheritance.

Credentials for Veeam
|
|
|
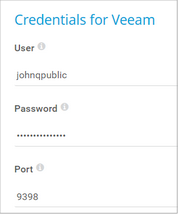
User Name
|
Enter the user name for access to the Veeam Backup Enterprise Manager.
|
Password
|
Enter the password for access to the Veeam Backup Enterprise Manager.
|
Port
|
Enter the port for the connection to the Veeam Backup Enterprise Manager. The default port for secure connections is 9398.
|
Windows Compatibility Options
Click  to interrupt the inheritance.
If you experience problems when you monitor via Windows sensors, use the following compatibility options for troubleshooting.

Windows Compatibility Options
|
|
|
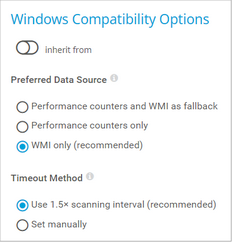
Preferred Data Source
|
 This setting only applies to hybrid sensors that use both performance counters and Windows Management Instrumentation (WMI). The setting does not apply to other sensors. This setting only applies to hybrid sensors that use both performance counters and Windows Management Instrumentation (WMI). The setting does not apply to other sensors.
Define the method that Windows sensors use to query data:
- Performance counters and WMI as fallback: Try to query data via performance counters. If this is not possible, establish a connection via WMI.
- Performance counters only: Query data via performance counters only. If this is not possible, the sensor returns no data.
- WMI only (recommended): Query data via WMI only. If this is not possible, the sensor returns no data. We recommend that you use this option.
|
Timeout Method
|
Select the time that the sensor waits for the return of the WMI query before the sensor cancels the query and shows an error message:
- Use 1.5× scanning interval (recommended): Multiply the scanning interval of the sensor by 1.5 and use the resulting value.
- Set manually: Manually enter a timeout value.
 We recommend that you use the default value. We recommend that you use the default value.
 If you experience ongoing timeout errors, try increasing the timeout value. If you experience ongoing timeout errors, try increasing the timeout value.
|
Timeout (Sec.)
|
This setting is only visible if you select Set manually above. Enter the time the sensor waits for the return of its WMI query before it cancels it and shows an error message. Enter an integer. The maximum timeout value is 900 seconds (15 minutes).
|
SNMP Compatibility Options
Click  to interrupt the inheritance.
If you experience problems when you monitor via Simple Network Management Protocol (SNMP) sensors, use the following compatibility options for troubleshooting.

SNMP Compatibility Options
|
|
|
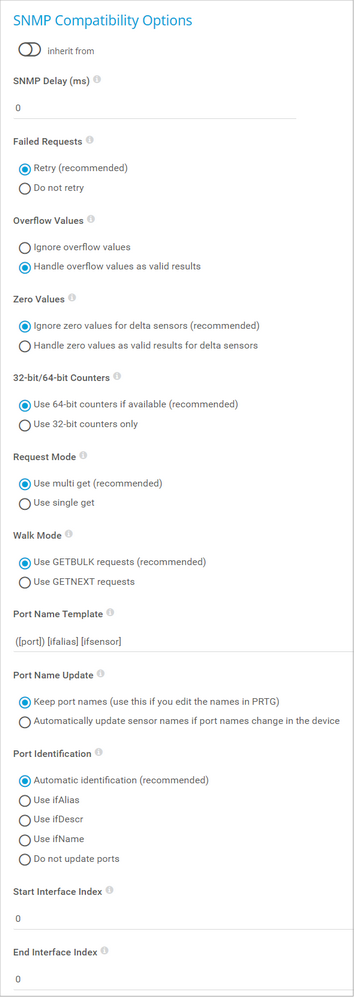
SNMP Delay (ms)
|
Enter the time in milliseconds (ms) that PRTG waits between two SNMP requests. This can increase device compatibility. Enter an integer. You can define a delay between 0 and 100. PRTG does not support higher delays.
 We recommend that you use the default value. We recommend that you use the default value.
 If you experience SNMP connection failures, try increasing the delay. If you experience SNMP connection failures, try increasing the delay.
|
Failed Requests
|
Select if an SNMP sensor tries again after a request fails:
- Retry (recommended): Try again if an SNMP request fails. This can prevent false error messages because of temporary timeout failures.
- Do not retry: Do not retry if an SNMP request fails. If you select this option, an SNMP sensor shows a Down status earlier.
|
Overflow Values
|
Select how PRTG handles overflow values. Some devices do not correctly handle internal buffer overflows. This can cause false peaks.
- Ignore overflow values: Ignore overflow values and do not include them in the monitoring data. We recommend that you use this option.
- Handle overflow values as valid results: Regard all overflow values as regular data and include them in the monitoring data.
 If you experience problems because of strange peaks in your data graphs, change this option. Peaks might indicate that the target device resets counters without an overflow. PRTG interprets such behavior as overflow that results in data peaks. Select the option Ignore overflow values in this case. For more details, see the Knowledge Base: What is the Overflow Values setting in the SNMP Compatibility Options? If you experience problems because of strange peaks in your data graphs, change this option. Peaks might indicate that the target device resets counters without an overflow. PRTG interprets such behavior as overflow that results in data peaks. Select the option Ignore overflow values in this case. For more details, see the Knowledge Base: What is the Overflow Values setting in the SNMP Compatibility Options?
|
Zero Values
|
Select how PRTG handles zero values. Some devices send incorrect zero values. This can cause false peaks.
- Ignore zero values for delta sensors (recommended): Ignore zero values and do not include them in the monitoring data. We recommend that you use this option.
 If you experience problems, try changing this option. If you experience problems, try changing this option.
- Handle zero values as valid results for delta sensors: Regard all zero values as regular data and include them in the monitoring data.
|
32-bit/64-bit Counters
|
Select the type of traffic counters that PRTG searches for on a device:
- Use 64-bit counters if available (recommended): The interface scan uses 64-bit traffic counters, if available. This can avoid buffer overflows in the devices
 We recommend that you use the default value. We recommend that you use the default value.
 If you experience problems, try changing this option. If you experience problems, try changing this option.
- Use 32-bit counters only: The interface scan always uses 32-bit traffic counters, even if 64-bit counters are available. This can make monitoring more reliable for some devices.
|
Request Mode
|
Select the request method that PRTG uses for SNMP sensors:
- Use multi get (recommended): Bundle multiple SNMP requests into one request. We recommend that you use this option.
 If you experience problems, try changing this option. If you experience problems, try changing this option.
- Use single get: Use one request for each SNMP value. This can increase compatibility with older devices.
 PRTG uses paging for SNMP requests. This means that if a sensor has to query more than 20 object identifiers (OID), it automatically polls the OIDs in packages of 20 OIDs each. PRTG uses paging for SNMP requests. This means that if a sensor has to query more than 20 object identifiers (OID), it automatically polls the OIDs in packages of 20 OIDs each.
|
Walk Mode
|
Select the kind of SNMP walk that PRTG uses for SNMP sensors:
- Use GETBULK requests (recommended): Request the next x OIDs in one SNMP request. The default value is 10. It is dynamic based on the response size.
 This option only works with devices that support SNMP version v2c or higher. Make sure that you set the correct SNMP Version in the Credentials for SNMP Devices settings of the parent device or inherit it from objects that are higher in the object hierarchy. This option only works with devices that support SNMP version v2c or higher. Make sure that you set the correct SNMP Version in the Credentials for SNMP Devices settings of the parent device or inherit it from objects that are higher in the object hierarchy.
- Use GETNEXT requests: Request one OID at a time. This can increase compatibility with older devices or with devices that have insufficient SNMP BULKWALK support.
|
Port Name Template
|
Select how PRTG displays the name of SNMP sensors. Enter a template that uses several variables. When you add new sensors, PRTG scans the interface for available counters at certain OIDs. At each OID, several fields with interface descriptions are usually available. They are different for every device and OID. PRTG uses the information in these fields to name the sensors. If a field is empty or if it is not available, PRTG adds an empty string to the name. By default, the port name template is ([port]) [ifalias] [ifsensor], which creates a name like (001) Ethernet1 Traffic. You can use and combine any field names that are available at an OID of your device, for example:
- [port]: The port number of the monitored interface.
- [ifalias]: The 'alias' name for the monitored interface as specified by a network manager, providing a non-volatile handling.
- [ifname]: The textual name of the monitored interface as assigned by the local device.
- [ifdescr]: A textual string containing information about the target device or interface, for example, manufacturer, product name, or version.
- [ifspeed]: An estimate of the monitored interface's current bandwidth (Kbit/s).
- [ifsensor]: The type of the sensor, this is Traffic or RMON. This helps to differentiate between SNMP Traffic and SNMP RMON sensors.
 For more information about SNMP sensor names, see the Knowledge Base: How can I change the defaults for names automatically generated for new SNMP sensors? For more information about SNMP sensor names, see the Knowledge Base: How can I change the defaults for names automatically generated for new SNMP sensors?
|
Port Name Update
|
Select how PRTG reacts if you change the names of ports in your physical device (for example, a switch or router):
- Keep port names (use this if you edit the names in PRTG): Do not automatically adjust sensor names. This is the best option if you want to manually change names in PRTG.
- Automatically update sensor names if port names change in the device: If PRTG detects port name changes in your physical device, it tries to automatically adjust the sensor names accordingly.
 For more information about automatic name updates, see the Knowledge Base: SNMP Traffic sensors when the device changes them. For more information about automatic name updates, see the Knowledge Base: SNMP Traffic sensors when the device changes them.
|
Port Identification
|
Select the field that PRTG uses for SNMP interface identification:
- Automatic identification (recommended): Try the ifAlias field first to identify an SNMP interface and then try ifDescr.
 PRTG does not automatically try ifName. PRTG does not automatically try ifName.
- Use ifAlias: For most devices, ifAlias is the best field to use for unique interface names.
- Use ifDescr: Use this option if the port order of your device changes after a restart, and if no ifAlias field is available. For example, this is the best option for Cisco ASA devices.
 If you use this option, it is important that your device returns unique interface names in the ifDescr field. If you use this option, it is important that your device returns unique interface names in the ifDescr field.
- Use ifName: You can also use this option if no unique ifAlias is available.
 If you use this option, it is important that your device returns unique interface names in the ifName field. If you use this option, it is important that your device returns unique interface names in the ifName field.
- Do not update ports: Use this option to disable the automatic port identification.
|
Start Interface Index
|
 This setting only applies to SNMP Traffic sensors and to Cisco IP SLA sensors. This setting only applies to SNMP Traffic sensors and to Cisco IP SLA sensors.
Enter the index at which PRTG starts to query the interface range during sensor creation. Enter 0 for the automatic mode.
 We recommend that you use the default value. We recommend that you use the default value.
|
End Interface Index
|
 This setting only applies to SNMP Traffic sensors and to Cisco IP SLA sensors. This setting only applies to SNMP Traffic sensors and to Cisco IP SLA sensors.
Enter the index at which PRTG stops querying the interface range during sensor creation. Enter 0 for the automatic mode.
 We recommend that you use the default value. We recommend that you use the default value.
|
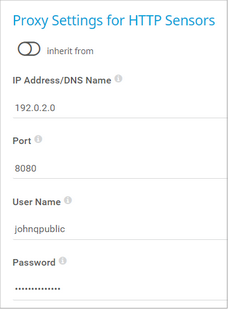
Proxy Settings for HTTP Sensors
Click  to interrupt the inheritance.
The proxy settings determine how a sensor connects to a URL. You can enter data for an HTTP proxy server that sensors use when they connect via HTTP or HTTPS.
 This setting only applies to HTTP sensors and how they monitor. To change the proxy settings for the PRTG core server, see section Core & Probes.
 The SSL Certificate sensor and the SSL Security Check sensor do not support HTTP proxies but you can configure connections via SOCKS proxies in the sensors' settings.

Proxy Settings for HTTP Sensors
|
|
|
IP Address/DNS Name
|
Enter the IP address or Domain Name System (DNS) name of the proxy server. If you leave this field empty, HTTP sensors do not use a proxy.
|
Port
|
Enter the port number of the proxy. The default is 8080. Enter an integer.
|
User Name
|
If the proxy requires authentication, enter the user name for the proxy login.
 Only basic authentication is available. Enter a string or leave the field empty. Only basic authentication is available. Enter a string or leave the field empty.
|
Password
|
If the proxy requires authentication, enter the password for the proxy login.
 Only basic authentication is available. Enter a string or leave the field empty. Only basic authentication is available. Enter a string or leave the field empty.
|
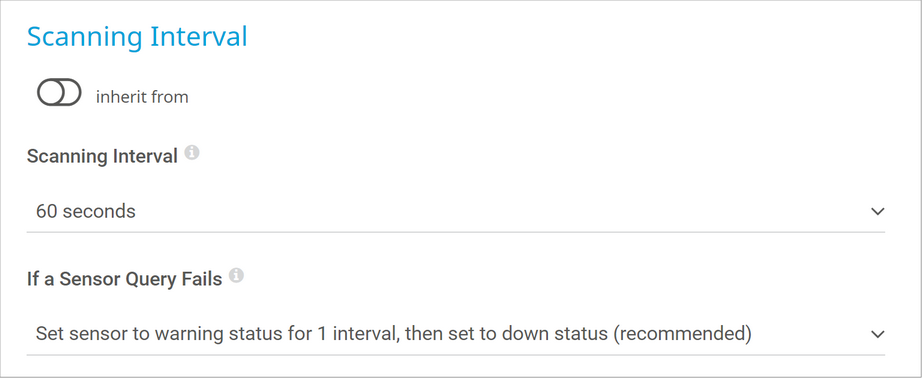
Scanning Interval
Click  to interrupt the inheritance.

Scanning Interval
Scanning Interval
|
Select a scanning interval from the dropdown list. The scanning interval determines the amount of time that the sensor waits between two scans. Choose from:
- 30 seconds
- 60 seconds
- 5 minutes
- 10 minutes
- 15 minutes
- 30 minutes
- 1 hour
- 4 hours
- 6 hours
- 12 hours
- 24 hours
 You can change the available intervals in the system administration of PRTG Network Monitor. You can change the available intervals in the system administration of PRTG Network Monitor.
|
If a Sensor Query Fails
|
Select the number of scanning intervals that the sensor has time to reach and to check a device again if a sensor query fails. Depending on the option that you select, the sensor can try to reach and to check a device again several times before the sensor shows the Down status. This can avoid false alarms if the target device only has temporary issues. For previous scanning intervals with failed requests, the sensor shows the Warning status. Choose from:
- Set sensor to down status immediately: Set the sensor to the Down status immediately after the first request fails.
- Set sensor to warning status for 1 interval, then set to down status (recommended): Set the sensor to the Warning status after the first request fails. If the second request also fails, the sensor shows the Down status.
- Set sensor to warning status for 2 intervals, then set to down status: Set the sensor to the Down status only after the third request fails.
- Set sensor to warning status for 3 intervals, then set to down status: Set the sensor to the Down status only after the fourth request fails.
- Set sensor to warning status for 4 intervals, then set to down status: Set the sensor to the Down status only after the fifth request fails.
- Set sensor to warning status for 5 intervals, then set to down status: Set the sensor to the Down status only after the sixth request fails.
 Sensors that monitor via Windows Management Instrumentation (WMI) always wait at least one scanning interval before they show the Down status. It is not possible to immediately set a WMI sensor to the Down status, so the first option does not apply to these sensors. All other options can apply. Sensors that monitor via Windows Management Instrumentation (WMI) always wait at least one scanning interval before they show the Down status. It is not possible to immediately set a WMI sensor to the Down status, so the first option does not apply to these sensors. All other options can apply.
 If you define error limits for a sensor's channels, the sensor immediately shows the Down status. None of the interval options apply. If you define error limits for a sensor's channels, the sensor immediately shows the Down status. None of the interval options apply.
 If a channel uses lookup values, the sensor immediately shows the Down status. None of the interval options apply. If a channel uses lookup values, the sensor immediately shows the Down status. None of the interval options apply.
|
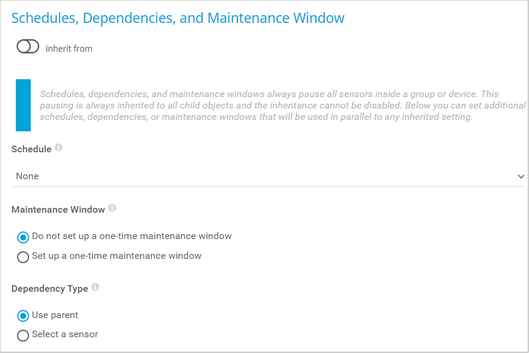
Schedules, Dependencies, and Maintenance Window
Click  to interrupt the inheritance.

Schedules, Dependencies, and Maintenance Window
|
|
|
Schedule
|
Select a schedule from the list. You can use schedules to monitor during a certain time span (days or hours) every week. Choose from:
- None
- Saturdays
- Sundays
- Weekdays
- Weekdays Eight-To-Eight (08:00 - 20:00)
- Weekdays Nights (17:00 - 09:00)
- Weekdays Nights (20:00 - 08:00)
- Weekdays Nine-To-Five (09:00 - 17:00)
- Weekends
 You can create schedules, edit schedules, or pause monitoring for a specific time span. For more information, see section Schedules. You can create schedules, edit schedules, or pause monitoring for a specific time span. For more information, see section Schedules.
|
Maintenance Window
|
Select if you want to set up a one-time maintenance window. During a maintenance window, monitoring stops for the selected object and all child objects. They show the Paused status instead. Choose between:
- Do not set up a one-time maintenance window: Do not set up a one-time maintenance window. Monitoring is always active.
- Set up a one-time maintenance window: Set up a one-time maintenance window and pause monitoring. You can define a time span for the pause below.
 To terminate an active maintenance window before the defined end date, change the time entry in Maintenance Ends to a date in the past. To terminate an active maintenance window before the defined end date, change the time entry in Maintenance Ends to a date in the past.
|
Maintenance Begins
|
Select if you want to set up a one-time maintenance window. During a maintenance window, monitoring stops for the selected object and all child objects. They show the Paused status instead. Choose between:
- Do not set up a one-time maintenance window: Do not set up a one-time maintenance window. Monitoring is always active.
- Set up a one-time maintenance window: Set up a one-time maintenance window and pause monitoring. You can define a time span for the pause below.
|
Maintenance Ends
|
This setting is only visible if you enable Set up a one-time maintenance window above. Use the date time picker to enter the start date and time of the one-time maintenance window.
|
Dependency Type
|
Select a dependency type. You can use dependencies to pause monitoring for an object depending on the status of a different object. You can choose from:
- Use parent: Use the dependency type of the parent object.
- Select a sensor: Use the dependency type of the parent object. Additionally, pause the current object if a specific sensor is in the Down status or in the Paused status because of another dependency.
 You do not trigger a status change by dependency if you manually pause a master object or if you pause it by schedule. You do not trigger a status change by dependency if you manually pause a master object or if you pause it by schedule.
 To test your dependencies, select Simulate Error Status from the context menu of an object that other objects depend on. A few seconds later, all dependent objects are paused. You can check all dependencies under Devices | Dependencies in the main menu bar. To test your dependencies, select Simulate Error Status from the context menu of an object that other objects depend on. A few seconds later, all dependent objects are paused. You can check all dependencies under Devices | Dependencies in the main menu bar.
|
Dependency
|
This setting is only visible if you enable Select a sensor above. Click  and use the object selector to select a sensor on which the current object will depend. and use the object selector to select a sensor on which the current object will depend.
|
Dependency Delay (Sec.)
|
This setting is only visible if you select Select a sensor above. Define a time span in seconds for the dependency delay.
After the master sensor for this dependency returns to the Up status, PRTG additionally delays the monitoring of the dependent objects by the time span you define. This can prevent false alarms, for example, after a server restart or to give systems more time for all services to start. Enter an integer.
|
Access Rights
Click  to interrupt the inheritance.

User Access Rights in User Accounts Settings
|
|
|
User Group Access
|
Select the user groups that have access to the object. You see a table with user groups and group access rights. The table contains all user groups in your setup. For each user group, you can choose from the following group access rights:
- Inherited: Inherit the access rights settings of the parent object.
- No access: Users in this user group cannot see or edit the object. The object neither shows up in lists nor in the device tree.
 There is one exception: If a user in this user group has access to a child object, the parent object is visible in the device tree but users in this user group cannot access it. There is one exception: If a user in this user group has access to a child object, the parent object is visible in the device tree but users in this user group cannot access it.
- Read access: Users in this group can see the object and view its monitoring results. They cannot edit any settings.
- Write access: Users in this group can see the object, view its monitoring results, and edit its settings. They cannot edit its access rights settings.
- Full access: Users in this group can see the object, view its monitoring results, edit its settings, and edit its access rights settings.
To automatically set all child objects to inherit this object's access rights, enable the Revert children's access rights to inherited option.
 For more details on access rights, see section Access Rights Management. For more details on access rights, see section Access Rights Management.
|
Channel Unit Configuration
Click  to interrupt the inheritance.

Channel Unit Configuration
|
|
|
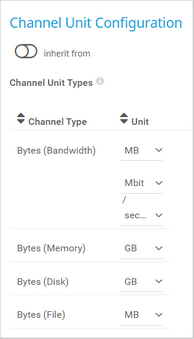
Channel Unit Types
|
For each type of channel, select the unit in which PRTG displays the data. If you define this setting on probe, group, or device level, you can inherit these settings to all sensors underneath. You can set units for the following channel types (if available):
- Bandwidth
- Memory
- Disk
- File
- Custom
 Custom channel types are only available on sensor level. Custom channel types are only available on sensor level.
|
Advanced Network Analysis
Click  to interrupt the inheritance.

Advanced Network Analysis
|
|
|
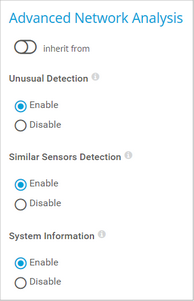
Unusual Detection
|
Select if you want to use the unusual detection for sensors:
- Enabled: Activates the unusual detection for this object and, by default, for all objects underneath in the object hierarchy. Sensors that are affected by this setting show the Unusual status if PRTG detects unusual activity.
- Disabled: Does not activate the unusual detection. PRTG ignores unusual values for sensors that are affected by this setting. These sensors do not show the Unusual status.
 You can configure the behavior of the unusual detection or completely disable it in the system settings. You can configure the behavior of the unusual detection or completely disable it in the system settings.
|
Similar Sensors Detection
|
Select if you want to activate the similar sensors analysis:
- Enabled: Activates the similar sensors detection for this object and, by default, for all objects underneath in the object hierarchy. PRTG considers all sensors that are affected by this setting during the similarity analysis.
- Disabled: Does not activate the similar sensors detection. PRTG does not consider sensors that are affected by this setting during the similarity analysis.
 You can configure the depth of the analysis of the similar sensors detection or completely disable it in the system settings. You can configure the depth of the analysis of the similar sensors detection or completely disable it in the system settings.
|
System Information
|
Select if you want to retrieve and show system information for your devices:
- Enabled: Activates the system information feature for this object and, by default, for all objects underneath in the hierarchy.
- Disabled: Does not activate the system information feature.
 The System Information feature is enabled by default. To retrieve the data, PRTG automatically uses the credentials for Windows systems and the credentials for SNMP devices that you entered in the device settings or that the device inherits from a parent object like the root group. Consider this when you monitor devices that are outside of your local network, especially when you use SNMP v1 or SNMP v2c, which do not provide encryption. The System Information feature is enabled by default. To retrieve the data, PRTG automatically uses the credentials for Windows systems and the credentials for SNMP devices that you entered in the device settings or that the device inherits from a parent object like the root group. Consider this when you monitor devices that are outside of your local network, especially when you use SNMP v1 or SNMP v2c, which do not provide encryption.
 This setting is not available on the hosted probe of a PRTG Hosted Monitor instance. This setting is not available on the hosted probe of a PRTG Hosted Monitor instance.
|
Number of Sensors Limitation

Number of Sensors Limitation
|
|
|
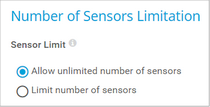
Sensor Limit
|
This setting allows you to set a limit for the maximum number of sensors in this group, including subgroups. If the amount of sensors exceeds the limitation, PRTG sets the surplus sensors to the Paused status. Choose between:
- Allow unlimited number of sensors: Do not limit the number of sensors for this group. Any number of sensors are allowed in this group and its subgroups.
- Limit number of sensors: Set a limitation for the number of sensors in this group. Only a defined number of sensors are allowed in this group and its subgroups.
|
Maximum Number of Sensors
|
This setting is only visible if you select Limit number of sensors above. Define how many sensors are allowed in this group and its subgroups. Sensors that exceed this group sensor limit are set to the Paused status. Enter an integer.
 Sensors that are in the Paused status count for this group limit as well (for example, manually paused sensors or sensors that are paused by dependency or schedule), but not for the number of available sensors in your license. Sensors that are in the Paused status count for this group limit as well (for example, manually paused sensors or sensors that are paused by dependency or schedule), but not for the number of available sensors in your license.
 Manually paused sensors override the sensor message exceeds group sensor limit. Manually paused sensors override the sensor message exceeds group sensor limit.
|
 Save your settings. If you change tabs or use the main menu without saving, all changes to the settings are lost.
More
 Knowledge Base
What security features does PRTG include?
How do I set permissions for the Amazon Web Services (AWS) API key to use certain sensors in PRTG?
Where can I find the Web Services API (WSAPI) port for the connection to the HPE 3PAR system?
How do I obtain credentials and set permissions for the Microsoft 365 Service Status sensors?
How do I obtain credentials and create custom roles for the Microsoft Azure sensors?
What is the Overflow Values setting in the SNMP Compatibility Options?
How can I change the defaults for names automatically generated for new SNMP sensors?
SNMP Traffic sensors when the device changes them


